The U.S. is facing a federal debt crisis. With current and anticipated federal deficits over the coming years, the amount of outstanding federal debt held by the public is expected to rise sharply. Interest payments on this debt are similarly expected to rise given this higher debt load and the consensus that interest rates will generally rise in the near future.
As noted in the following charts:
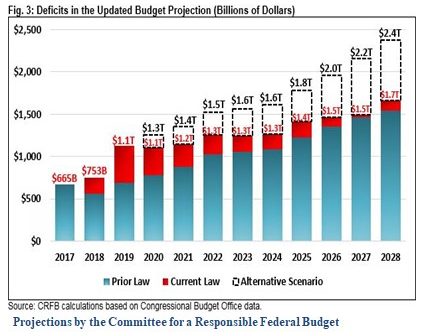
- While the U.S. federal deficit is projected to be $750 billion in the current fiscal year ending September 30, 2018, it is expected to exceed $1 trillion next year and reach $2 trillion by 2026. [Chart 1]
- As such, the $21 trillion of federal debt held by the public is expected to grow from the current 77% of GDP to almost 100% by 2028. [Chart 2]
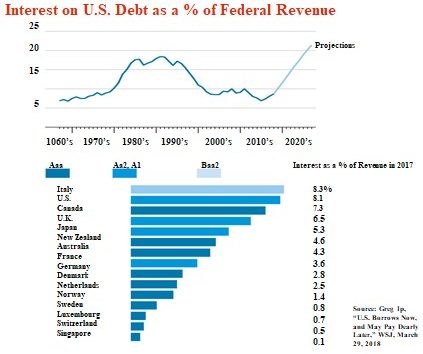
- Interest expense on debt held by the U.S. public equaled just under $300 billion in 2017, which represented 8.1% of total federal revenue. Compared with other industrialized countries, this figure was exceeded only by Italy. [Chart 3]
- With the anticipated increase in outstanding federal debt and the likely increase in interest rates across all maturities and all types of securities, Moody’s projects that interest will exceed 21% of federal revenue by 2024. [Chart 3]
Why is this important? Consider the trends in federal spending. Mandatory (largely Medicare, Medicaid, Social Security) spending currently accounts for approximately 12% of GDP; discretionary spending represents 5.5% of GDP and net interest accounts for 1.5% of GDP according to the Congressional Budget Office (CBO). [See Chart 4.] Without Congress making changes in spending on entitlement programs, discretionary spending must decline relative to GDP. The essential conclusion is that Congress should either: 1) reduce, or at least, slow the growth in spending on Medicare, Medicaid and Social Security; 2) increase federal tax revenues; or 3) sharply accelerate the growth in GDP. Otherwise, discretionary spending that funds the Departments of Defense, Health & Human Services, State Department, Education, VA, HUD, etc. must be cut.
Chart 1

Chart 2

Source: The Budget and Economic Outlook: 2018 to 2018, CBO, April 9, 2018
Chart 3

Chart 4

by Timothy Koch, President, Graduate School of Banking at Colorado

